
What the Gold-Silver Ratio Actually Measures

The gold-silver ratio measures how many ounces of silver it takes to buy one ounce of gold. At a reading of 75:1, for instance, you would need 75 ounces of silver to equal the value of a single ounce of gold. The math is straightforward, but the implications can be profound.
This number is more than a curiosity. It’s one of the most closely watched indicators in precious metals markets, offering a relative value signal between the two metals. When the ratio rises, silver is cheap relative to gold; when it falls, silver is expensive relative to gold.
Historically, the ratio has ranged from below 20:1 in the ancient world to above 120:1 briefly during the COVID-19 panic of March 2020. The modern average across the past century sits somewhere between 50:1 and 65:1.
Where the Ratio Has Been: A Turbulent Recent History

The gold-silver ratio has exceeded 100 only a handful of times in the past century, notably in 1939, 1991, and 2020, and each instance was followed by major silver outperformance. The most recent extreme followed a familiar script.
The ratio increased by more than 15 points in less than a month during March and April 2025, reflecting just how volatile this metric can become when macro stress arrives suddenly. That spike, however, set up what came next.
By early 2026, the gold-to-silver ratio compressed to approximately 57:1, a compression of nearly 45 points from April’s extreme. That compression tells the story of silver’s explosive outperformance.
Silver’s Remarkable 2025 Run
During 2025, silver underwent a nearly 130% increase in value, starting the year at $29/oz and rising to over $70/oz by year end. That kind of move rarely happens in a metal with silver’s market depth, and it drew the attention of a new wave of institutional investors.
Gold’s 2025 performance was also exceptional. A 67% gain marked one of its strongest years in decades, fueled by relentless central bank buying, persistent inflation pressures, and rising geopolitical risk. Silver, though, went further.
Silver’s 147% surge was extraordinary by any measure. Investors who accumulated silver when the gold-to-silver ratio exceeded 100:1 didn’t just outperform, they more than doubled the gains of portfolios holding gold alone.
The 80x Signal and What History Says About It

A high ratio above 80:1 often signals silver is undervalued, while a low ratio below 50:1 typically suggests gold may offer better relative value. This is the core logic behind one of the most enduring tactical frameworks in precious metals investing.
The “80/50 rule” is a tactical investment strategy based on the gold-silver ratio. It constantly fluctuates based on market conditions, economic sentiment, and supply-demand dynamics for both metals.
From a historical perspective, when you see gold-silver ratios well above the historical average, it signals that silver is underpriced compared to gold and there is a strong possibility that silver will go on a bull run to close that gap. Historically, this has often happened in the midst of a gold bull rally, with silver outperforming gold. Past performance, of course, carries no guarantee of future results.
The Industrial Demand Engine Driving Silver’s New Identity

Sectors such as solar energy, automotive electric vehicles and their infrastructure, and data centers and artificial intelligence will drive industrial demand higher through 2030, according to the Silver Institute. This is a structural shift, not a cyclical bump.
In 2014, the solar sector accounted for around 11% of silver demand. That rose to 29% in 2024. The speed of that transition is striking, and it shows no sign of slowing.
Electric vehicles require significantly more silver than traditional internal combustion vehicles, with silver used in battery management systems, power electronics, charging infrastructure, and electrical contacts. EVs consume, on average, 67 to 79 percent more silver than internal combustion vehicles, with approximately 25 to 50 grams of silver per EV.
A Supply Problem That Won’t Be Easily Fixed
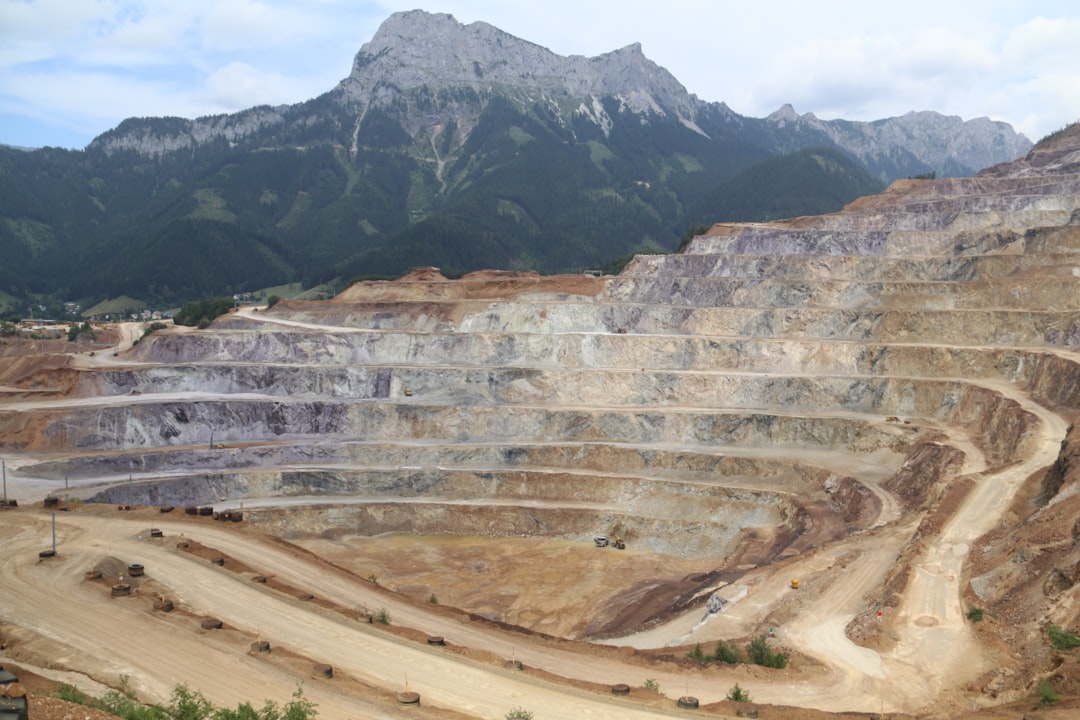
Silver mine supply grew only modestly from 2020 to 2025, roughly 820 to 840 million ounces annually. Unlike gold, approximately 70% of silver is produced as a by-product of copper, zinc, and lead mining, meaning supply does not respond quickly or proportionally to silver price increases.
Global silver mining yields approximately 830 million ounces annually, but this has grown just 1 to 2% yearly while industrial consumption increases 4 to 6% annually. That arithmetic, sustained over years, creates a structural gap that is difficult to reverse quickly.
The market has been grappling with a structural supply deficit for five consecutive years, accumulating approximately 800 million ounces since 2021, nearly a full year of global production. Physical silver availability on major exchanges has tracked this pressure closely.
Five Consecutive Years of Supply Deficits
Even as demand adjustments played out in 2025, the silver market remained in deficit, marking the fifth consecutive year. This is not a short-term anomaly. It reflects a structural mismatch between what the world can mine and what the world now needs.
With the silver market on track for its fifth straight structural market deficit, growing tech offtake will only add pressure. Metals Focus projects demand will outstrip supply by 95 million ounces, which would bring the cumulative five-year deficit to 820 million ounces, an entire year of average mine output.
Inventories on major exchanges like the London Metal Exchange and COMEX have plummeted to historic lows, creating a physical market squeeze that has exacerbated price pressures. When inventory cushions shrink to this degree, price responses to demand shocks tend to be amplified.
The AI and Data Center Factor Most Investors Overlook

Data centers are providing the physical infrastructure needed to run cloud computing services and, increasingly, power AI systems. As digitalization and AI adoption accelerate, so does the demand for critical minerals such as silver used in their applications.
Total global information technology power capacity increased by approximately 53 times, from 0.93 GW in 2000 to nearly 50 GW in 2025. Each increment of that expansion draws on silver-intensive hardware and electrical systems.
A new demand vector has emerged with AI infrastructure specifically. Data centers are utilizing silver in high-efficiency electrical components, precision contacts, and thermal management systems designed to handle extreme power loads. This is a demand category that barely existed a decade ago.
What Central Banks Have to Do With It

Recessions, geopolitical conflicts, and inflation can all cause major shifts in the ratio. Gold is always the first price to move in response to these types of events, as it is the go-to safe haven asset for most people. If the unrest continues for an extended period, silver will begin to catch up.
Central banks buy gold, not silver. The 1,237 tonnes of gold purchased by central banks in 2025 representing one of the most powerful structural demand forces in the gold market simply does not exist for silver. No central bank holds meaningful silver reserves. This explains why gold often leads the rally while silver follows later, sometimes more aggressively.
A resumption of rate cuts in the second half of 2026 would simultaneously lift gold and compress the gold-silver ratio, the historically most powerful combination for silver appreciation. Monetary policy remains the wildcard for timing, but the structural backdrop for silver is already established.
Where Silver Stands in 2026 and What Analysts Are Projecting

J.P. Morgan Global Research sees silver prices averaging $81/oz in 2026, more than double its average in 2025, though this depends on many factors including global demand. That is a meaningful projection from a major institutional voice.
Silver hit a nominal all-time high of $121.64 in January 2026, yet adjusted for inflation, silver remains well below its 1980 peak and barely above its 2011 cycle high. In real purchasing power terms, the metal still has considerable historical headroom.
Silver’s designation as a “critical material” by the U.S. government in 2025 further highlights its strategic importance, indicating potential future policies aimed at securing domestic supply and enhancing supply chain resilience. That status matters for long-term demand floors, particularly from government-backed clean energy programs.
Risks, Caveats, and the Limits of Ratio Analysis
Determining whether the ratio is going to spike or compress at any given moment is quite difficult. It is probably wiser to make long-term decisions with it rather than short-term ones. The ratio says nothing about the underlying causes of either metal’s shifts in value.
If the global economy slides into recession, gold is expected to outperform. It is widely regarded as the world’s premier safe-haven asset in periods of heightened volatility, deflation risk, or equity selloffs. Silver, by contrast, may struggle in the early stages of a downturn. Its industrial linkages make it sensitive to manufacturing slowdowns, especially in electronics, automotive, and construction sectors.
A sustained supply deficit does not automatically translate to a price surge. Silver has run deficits for years without dramatic price responses. The deficit establishes a structural supply floor that becomes relevant when investment demand recovers, and when investment buyers return to a market already running a supply deficit, the price response tends to be amplified.
The silver story in 2026 is not a simple one. It involves a metal that straddles two worlds, one foot in monetary history and the other planted firmly in the technologies reshaping the global economy. The ratio that inspired this article has compressed significantly from its extremes, yet it continues to reflect a structural imbalance that took years to build. Whether the full mean reversion plays out slowly or sharply, the fundamentals now sit on a different foundation than at any point in silver’s modern history. That foundation, built from solar panels, EV wiring, AI data centers, and constrained mines, is unlikely to dissolve quietly.