

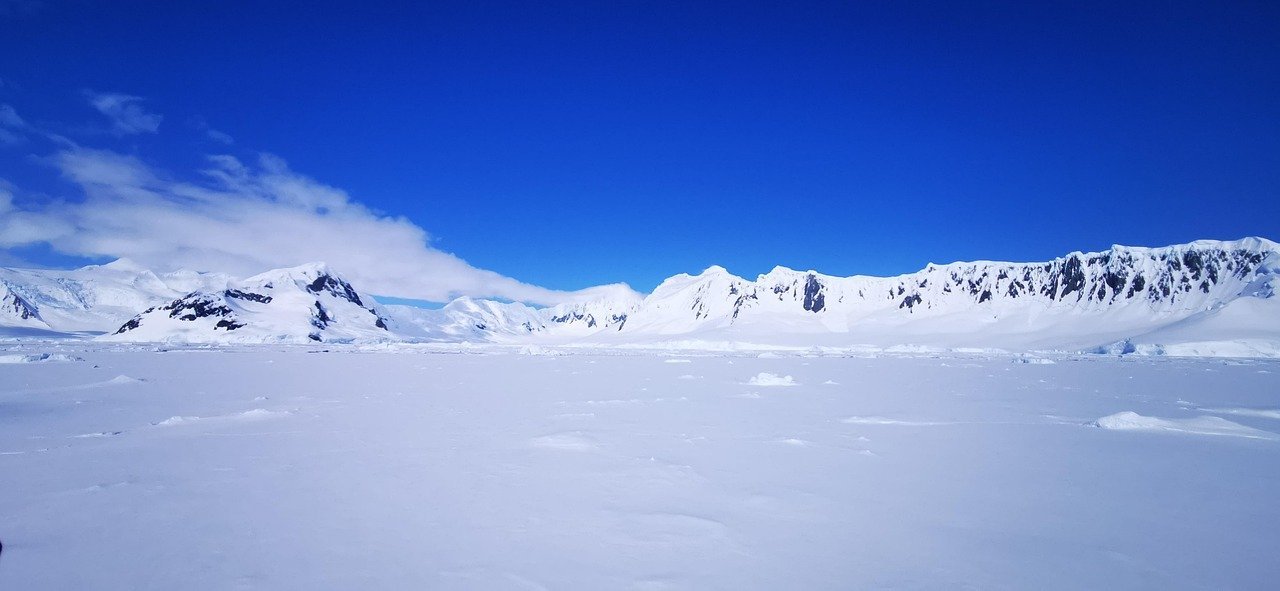
Antarctica has always kept its secrets well. The continent’s surface, clean and white and vast, gives almost nothing away. Beneath it, though, lies a world of hidden lakes, ancient river valleys, enormous cavities, and slow-moving heat that scientists are only now beginning to read with any real precision.
What’s changed is the technology doing the reading. Satellites equipped with radar altimeters and laser instruments are now capable of detecting changes in ice surface elevation measured in centimeters, even from hundreds of kilometers above Earth. Those tiny shifts on the surface, it turns out, betray enormous movements happening far below.
A Hidden World, Slowly Coming Into Focus
For decades, glaciologists understood that something complex was happening beneath Antarctica’s ice, but the tools to see it clearly were limited. Ground-based and airborne surveys could only cover so much territory in a continent larger than Europe.
What scientists know about the landscapes beneath Antarctica’s ice is, remarkably, less than what is known about the surface of Mercury. That comparison, striking as it sounds, is backed by real data gaps that researchers are still working to close.
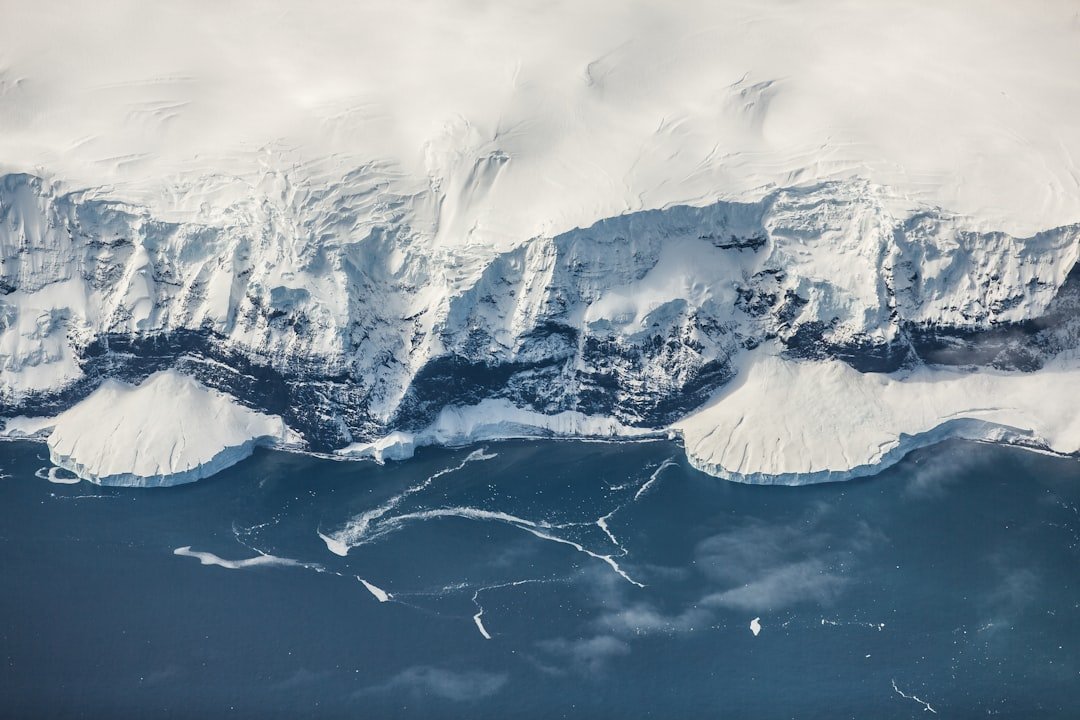
With the aid of satellite imagery, scientists have created the most detailed map to date of Antarctica’s subglacial topography. That map unveils a variety of terrains, including high-relief alpine valleys, scoured lowlands, and deeply eroded ice stream troughs, and the newly resolved topography will help refine projections of ice loss and sea level rise.
How Satellites Read What the Eye Cannot See
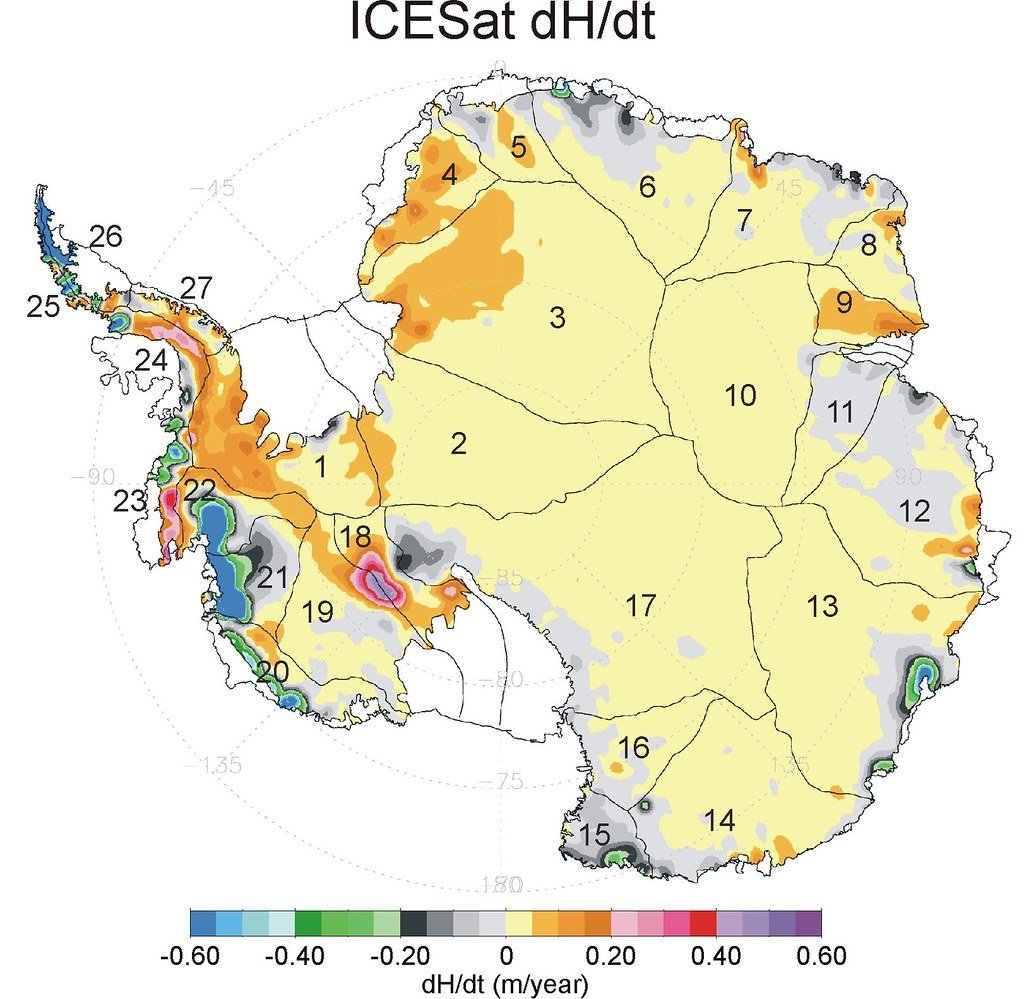
Measuring ice surface elevation changes with satellite laser altimeters flying hundreds of kilometers above Earth tells scientists where the Antarctic and Greenland ice sheets are thinning or thickening. Beyond that, it can also reveal hidden activity of subglacial lakes filling and draining beneath the ice, and meltwater rivers flowing out towards the coast.
NASA’s Ice, Cloud and land Elevation Satellite 2, or ICESat-2, allowed scientists to precisely map subglacial lakes. The satellite measures the height of the ice surface, which, despite its enormous thickness, rises or falls as lakes fill or empty under the ice sheet.
To create one of the most detailed maps of Antarctica’s subglacial topography yet, a team of researchers led by Helen Ockenden applied a modeling technique known as Ice Flow Perturbation Analysis, which uses detailed satellite observations of the ice surface and the physics of ice flow to infer the topography that exists below the ice. This approach essentially uses the ice itself as a lens.
85 New Subglacial Lakes Discovered
A team of researchers, led by the University of Leeds, discovered 85 previously unknown subglacial lakes hidden beneath the Antarctic ice sheet. The findings increased the number of known subglacial lakes to 231 and detailed five new connected lake networks and drainage pathways.
The study used ten years of data from the European Space Agency’s CryoSat-2 mission, to observe changes in ice sheet elevation indicating the filling and draining of subglacial lakes, locating and mapping them as they evolve over time. The vertical resolution of CryoSat-2 data is a few centimeters at best, and the team found 85 regions that changed in height not by centimeters but rather by meters – robust signals that very likely correspond to active subglacial lakes.
Hidden beneath the biggest ice mass on Earth, hundreds of subglacial lakes form a crucial part of Antarctica’s icy structure, affecting the movement and stability of glaciers, and consequently influencing global sea level rise. Researchers also noted five regions across Antarctica where discovered lakes appeared to be connected, inferred by observing upstream draining events in some lakes that were nearly contemporaneous with downstream filling events in other nearby lakes, hinting at a complicated hydrological network beneath the ice sheet.
The Heat From Below: Geothermal Forces at Work
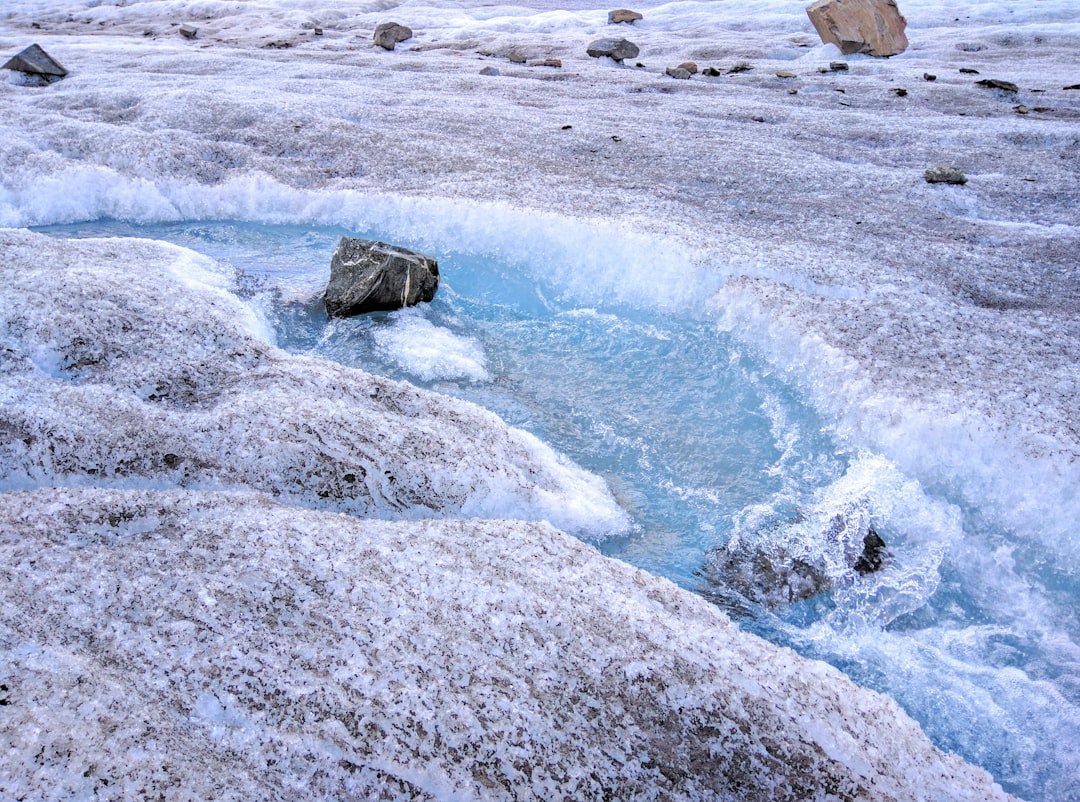
Geothermal heat and friction created by hundreds of meters of ice sliding over Earth’s bedrock creates pools of meltwater at the ice sheet base. Water can be produced at the base of the ice sheet from pressure melting of the overlying ice, geothermal heat from the ground, and frictional heat produced from fast ice flow.
Subglacial meltwater forms due to geothermal heat from Earth’s bedrock surface and frictional heat as ice slides over bedrock. This meltwater can pool on the bedrock surface and periodically drains. The flow of water has the potential to reduce friction between the ice and the bedrock it sits on, allowing ice to slide more quickly into the ocean.
Lake Vostok is the largest known subglacial lake, with enough water to overflow the Grand Canyon, and is thought to be stable. Draining of stable lakes like Lake Vostok could have a considerable impact on the ice sheet, how it might drain, and therefore the circulation systems of surrounding oceans and sea level rise.
The Thwaites Glacier Void: A Case Study in Alarm
A team of glaciologists led by researchers at the University of California, Irvine used high-resolution satellite radar data to find evidence of the intrusion of warm, high-pressure seawater many kilometers beneath the grounded ice of West Antarctica’s Thwaites Glacier. The study, published in the Proceedings of the National Academy of Sciences, said that widespread contact between ocean water and the glacier causes “vigorous melting” and may require a reassessment of global sea level rise projections.
Researchers found that the buoyant plume from subglacial discharge temporarily doubled the rate of ocean melting under Thwaites, thinning the ice shelf. These events likely contributed to Thwaites’ rapid thinning and grounding line retreat during that period.
Scientists identified 27 active subglacial lakes beneath Thwaites Glacier. Previously, the existence of only seven active subglacial lakes had been reported beneath this glacier, one of West Antarctica’s largest, predicted to significantly impact future sea level rise. A re-evaluation of CryoSat-2 satellite radar altimeter data from 2010 to 2022 identified the expanded count. Thwaites contains the equivalent of roughly 60 centimeters of sea level rise.
An Ancient Landscape Frozen in Time
Long before Antarctica froze over, rivers carved valleys through mountains in the continent’s east. Researchers have discovered a remnant of this ancient highland landscape thanks to an aerial survey campaign led by the University of Texas Institute for Geophysics.
A preserved river landscape from the era when the bottom of the world was ice-free persists more than a mile below the East Antarctic Ice Sheet. The system consists of two deeply incised fjords and a series of stream paths that are completely invisible from the surface but for a few subtle elevation changes detectable by satellite.
According to the research, the landscape of ancient valleys and ridges formed at least 14 million years ago. The find is unusual because the tremendous weight and motion of the overlying ice sheet should have ground it away. The research team believes there are other undiscovered, ancient landscapes hidden beneath the ice sheet.
The Bedmap3 Revolution: A Clearer Picture of the Abyss
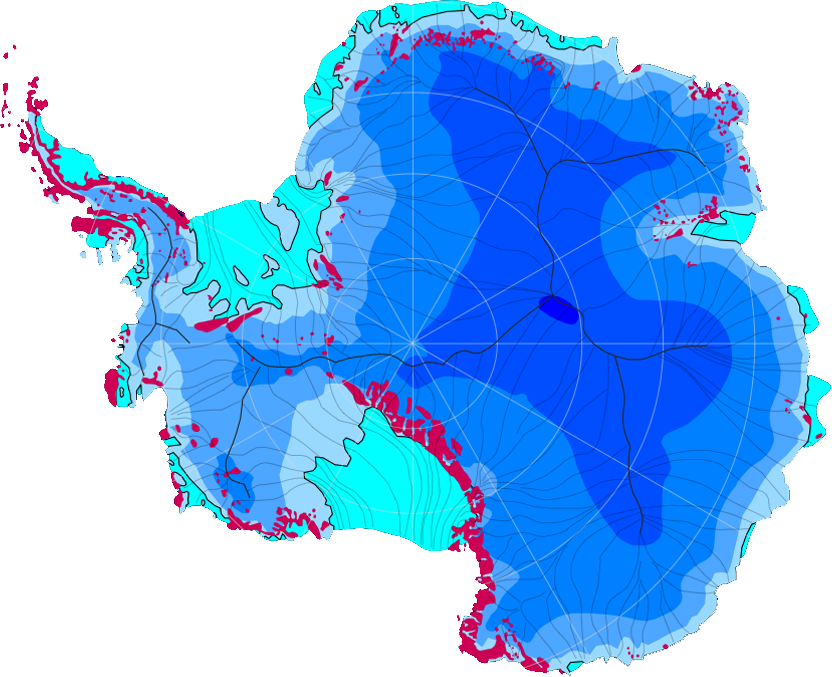
Scientists presented Bedmap3, the latest suite of gridded products describing surface elevation, ice-thickness, and the seafloor and subglacial bed elevation of the Antarctic. Bedmap3 incorporates 84 new aero-geophysical surveys by 15 data providers, an additional 52 million data points, and nearly two million line-kilometers of measurement.
These efforts have filled notable gaps including in major mountain ranges and the deep interior of East Antarctica, along West Antarctic coastlines and on the Antarctic Peninsula. The resulting maps reveal dramatic landscapes – features between two and thirty kilometers wide – including a steep-sided channel in the Maud Subglacial Basin that is nearly 400 kilometers long, six kilometers wide, and 50 meters deep, likely connected to ancient drainage systems from the mountains of Dronning Maud Land.
Because these structures predate the modern ice cap, they provide a vital geological blueprint for more accurately predicting how the continent will melt and contribute to global sea level rise. The discovery demonstrates how a massive, three-kilometer-thick ice sheet still carries the imprint of the ground beneath it.
The Scale of Ice Loss and What It Means for the Planet
Research based on satellite data indicates that between 2002 and 2023, Antarctica shed an average of 150 billion metric tons of ice per year, adding to global sea level rise. This loss was more than offset by significant ice mass loss on the West Antarctic Ice Sheet over the same period.
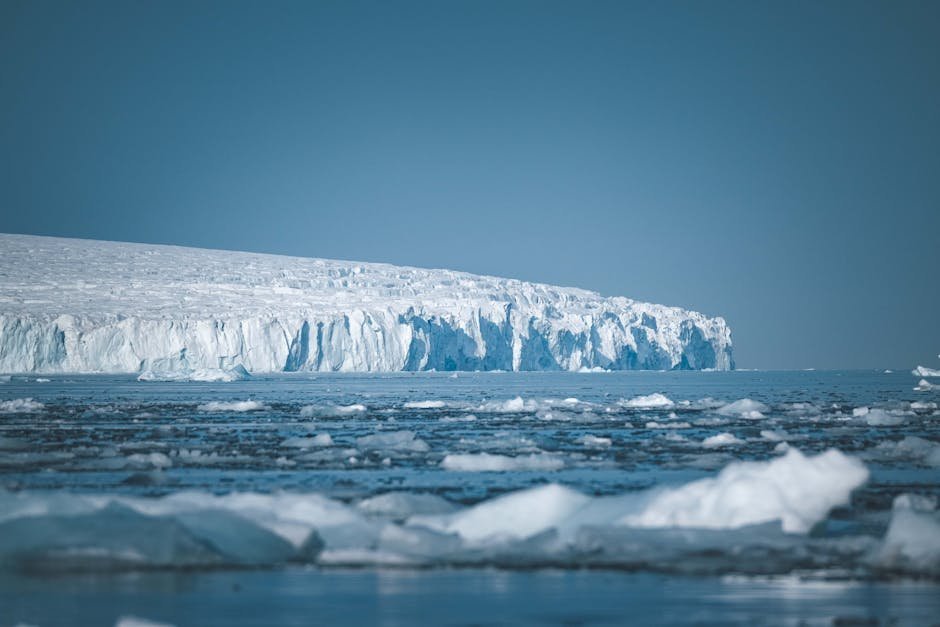
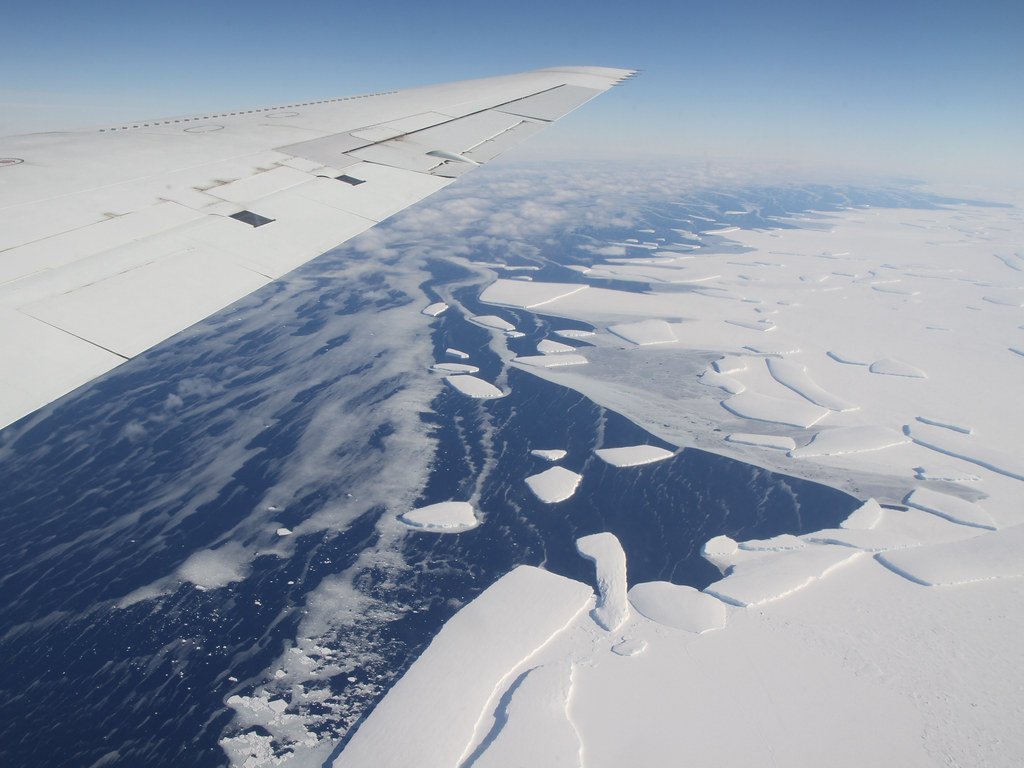
Satellite observations have revealed an alarming loss of ice density at Antarctica’s ice shelves over the past quarter century. Copernicus Sentinel-1 and CryoSat satellite missions showed that over 40% of these floating shelves of ice have significantly reduced in volume since 1997. The extensions of Antarctica’s land-based ice sheets act as a barrier, slowing the flow of ice into the ocean and stabilizing glaciers – meaning the region faces a risky double effect of shrinking ice shelves and increasingly rapid ice loss flowing to the ocean.
The ice sheet covering Antarctica holds roughly ninety percent of the world’s fresh water. Thwaites Glacier’s retreat has accelerated considerably over the past 40 years, and although a full collapse is unlikely in the next few decades, findings indicate it is set to retreat further, and faster, through the 21st and 22nd centuries, and general collapse of the West Antarctic Ice Sheet over this timeframe cannot be ruled out.
What the Models Are Still Missing
The numerical models currently used to project the contribution of entire ice sheets to sea level rise do not include subglacial hydrology. New datasets of subglacial lake locations, extents, and timeseries of change will be used to develop understanding of the processes driving water flow beneath Antarctica.
The findings suggest that existing climate models are underestimating the impact of ocean and ice interactions in future sea level rise projections. Upwelling from the release of subglacial meltwater can enhance the ocean’s melting ability, though its efficacy is not well understood and is not represented in current ice sheet loss projections.
The new mapping provides a more stable foundation for climate models, allowing scientists to pinpoint exactly where ice is most vulnerable and reducing the guesswork in future sea-level projections. That is real progress. Still, the gap between what satellites can see and what models can calculate remains a genuine scientific challenge – one researchers are actively working to close before the ice moves faster than the forecasts.